Telemon: Pharo metrics for Telegraf
In my previous post on the TIG monitoring stack, I mentioned that Telegraf supports a large number of input plugins. One of these is the generic HTTP plugin that collects from one or more HTTP(S) endpoints producing metrics in supported input data formats.
I've implemented Telemon, a Pharo package that allows producing Pharo VM and application-specific metrics compatible with the Telegraf HTTP input plugin.
Telemon works as a Zinc ZnServer delegate. It produces metrics in the
InfluxDB line protocol format.
By default, Telemon produces the metrics generated by
VirtualMachine>>statisticsReport and its output looks like this:
TmMetricsDelegate new renderInfluxDB
"pharo uptime=1452854,oldSpace=155813664,youngSpace=2395408,memory=164765696,memoryFree=160273136,fullGCs=3,fullGCTime=477,incrGCs=9585,incrGCTime=9656,tenureCount=610024"
As per the InfluxDB line protocol, 'pharo' is the name of the measurement, and the items in key-value format form the field set.
To add a tag to the measurement:
| tm |
tm := TmMetricsDelegate new.
tm tags at: 'host' put: 'telemon-1'.
tm renderInfluxDB
"pharo,host=telemon-1 uptime=2023314,oldSpace=139036448,youngSpace=5649200,memory=147988480,memoryFree=140242128,fullGCs=4,fullGCTime=660,incrGCs=14291,incrGCTime=12899,tenureCount=696589"
Above, the tag set consists of "host=telemon-1".
Here's another invocation that adds two user-specified metrics but no tag.
| tm |
tm := TmMetricsDelegate new.
tm fields
  at: 'meaning' put: [ 42 ];
  at: 'newMeaning' put: [ 84 ].
tm	renderInfluxDB
"pharo uptime=2548014,oldSpace=139036448,youngSpace=3651736,memory=147988480,memoryFree=142239592,fullGCs=4,fullGCTime=660,incrGCs=18503,incrGCTime=16632,tenureCount=747211,meaning=42,newMeaning=84"
Note that the field values are Smalltalk blocks that will be evaluated dynamically.
When I was reading the specifications for Telegraf's plugins, the InfluxDB line protocol, etc., it all felt rather dry. I imagine this short post is the same so far for the reader who isn't familiar with how the TIG components work together. So here are teaser screenshots of the Grafana panels for the Pharo VM and blog-specific metrics for this blog, which I will write about in the next post.
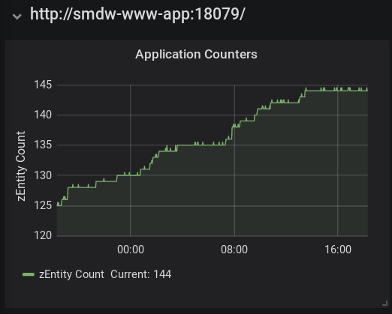
This Grafana panel shows a blog-specific metric named 'zEntity Count'.
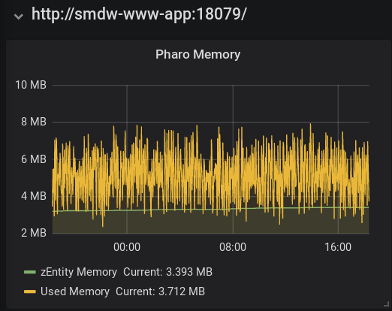
This next panel shows the blog-specific metric 'zEntity Memory' together with the VM metric 'Used Memory' which is the difference between the 'memory' and 'memoryFree' fields.
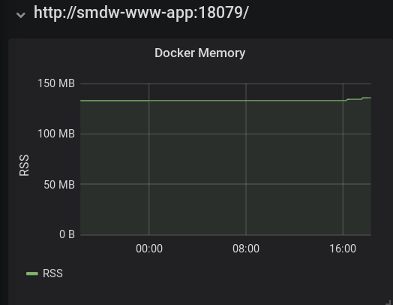
This blog runs in a Docker container. The final panel below shows the resident set size (RSS) of the container as reported by the Docker engine.